Paper presented at the annual meetings of the Southern Sociological Society in Chattanooga, TN on April 2, 1993. The authors gratefully acknowledge the valuable assistance of Jon Beckert, Brian Crisp, Michael Dalecki, Donna Evans, Bonnie Haswell, Michelle Hilhorst, Sarah Poulos, Christine Ransdell, Lisa Tripp, and Amy Whitcher. Direct all correspondence to Linda A. Mooney ([email protected]), Department of Sociology, East Carolina University, Greenville, NC 27858
With recent predictions of the increase in the numbers of homeless, there has been a renewed interest in estimating homeless populations in a variety of locations. While a considerable amount of research has been conducted on homelessness in urban areas, less research has been directed toward estimating and describing the numbers of homeless in rural or nonurban areas. Further, several methodological issues surrounding the definitions of urban, nonurban, and rural (Toomey, First, Green-lee, and Cummins 1993) have made comparisons between these locations difficult. Despite methodological confusion and the consensus that few comprehensive studies of nonurban and rural home-lessness exist (Lawrence 1995; Toomey et al. 1993; NCH 1997a; Fitchen 1992), researchers have been quick to conclude that rural and nonurban homelessness are demographi-cally different than urban homelessness. The present research fills the gap in the homeless literature by collecting data on the homeless in a nonurban location, and comparing the results to representative urban and rural samples. A discussion of homelessness within the context of recent welfare reform follows the presentation of results.
The study of homelessness has become “old hat” (Hopper 1998; Wright, Rubin and Devine 1998; Hambrick and Johnson 1998). Once the target of a flurry of research activity, by the early 1990’s the significance of homelessness as a major social problem had considerably diminished. For example, in 1985, 32 separate bills relating to homelessness were introduced in the U.S. Congress; by 1992, politicians were all but silent on the topic-- a topic soon to be dubbed as “last decade’s issue” (Wright et al. 1998:2). Further evidence is gleaned from the news media’s coverage of “the homeless problem”. In the fall of 1988, the New York Times carried over 50 articles on homelessness; in the fall of 1992, 25 and by the fall of 1998, ten. (Hsiao 1999).
Of the many reasons homelessness has faded from the public’s consciousness, one stands out--the tendency to view the problem as temporary (Hambrick and Johnson 1998; Wright et al. 1998). Such a belief led to quick fixes in which the day-to-day needs of the homeless became the focus of attention (e.g. food, shelter) rather than addressing structural constraints (e.g. lack of affordable housing) or individual deficiencies (e.g. alcoholism) (Priority Home! 1994; Wright et al 1998; America 1999).1 Thus, few significant changes in the causes of homelessness have been initiated and, with the signing of the 1996 welfare reform bill, the numbers of homeless are likely to increase dramatically over the next several years (NCH 1997; Willis 1997a; Applewhite 1997; Stanfield 1997; U.S. Conference of Mayors 1998; Wright et al. 1998).
Such predictions have led to a renewed interest in homelessness and a return to empirical documentation of the numbers and characteristics of the homeless to better develop policy directives. Estimates of the numbers of homeless and their characteristics have significantly changed over the years. Much of the variation in estimates is a result of definitional problems, that is, what constitutes homelessness (cf. Toomey et al. 1993) . Estimates also vary with the political persuasion of those involved-- activist, for example, versus government official. It is not surprising that calculations vary considerably, from a low of 300,000 to a high of several million (Barak 1991; National Law Center on Homelessness and Poverty 1996; NCH 1998; Wright et al. 1998).
While there is little agreement over the number of homeless, there is some consensus that they are a heterogeneous population, at least in urban areas where the bulk of research has been conducted (Rossi 1989; Barak 1991; Snow and Anderson 1993; Jencks 1994; NAEH 1998; Reganick 1997; NCH 1999). There is also evidence that the rural homeless are different than their urban counterparts, more often female, intact-families, white, and currently working. They also have lower rates of chronic substance abuse and mental illness, and are disproportionately Native Americans and migrant workers (First, Rife and Toomey 1994; NCH 1999; NRHA 1996; Vissing 1996; U.S. Department of Agriculture 1996; Butler 1997).
Considering the relatively few studies on rural homelessness, there is a remarkable lack of agreement as to what constitutes a “rural area” (Hewitt 1989: Toomey et al. 1993). Despite the implied dichotomy of a rural-urban designation, “the distribution of people and the density and form of living arrangements exist on a continuum” (Toomey et al. 1998: 25). The U.S. Census Bureau defines rural areas as incorporated locations that have a population of less than 2,500 residents, and unincorporated less densely populated areas. Urbanized areas are places with a population greater than 50,000. Any area with a population between 2,500 and 50,000 is simply considered a nonurban location (Hewitt 1989; Toomey et al. 1993; Statistical Abstract of The United States 1998).
Despite these relatively unambiguous definitions, in studies of rural homelessness the distinctions have become muddied. Butler defines small towns as cities which are “not incorporated ...but have populations of more than 2,500” (1997: 430); Vissing speaks of “urbanized rural areas” (1996:10); Segal investigates “two contiguous small towns” (1989:28); and Fitchen refers to “small towns and the open countryside” (1992:173).
Of even greater concern, many investigators appear willing to draw definitive conclusions about the differences between these ill-defined, inadequately researched areas. For example, Lawrence (1995:298) states that “...homelessness in the countryside is qualitatively different from homelessness in the city”. Similarly, Vissing (1996:12) concludes that “[H]omeless people in small towns are much more like those in rural areas than those in cities...”. Alternatively, Dahl, Harris and Gladden comment that comparisons of rural data from North Dakota to several urban samples suggest that “...the origin of homelessness, demographics, and medical problems of urban and rural homeless are quite similar” (1992:2).
The present research thus fills a gap in the homeless literature by: 1) providing a picture of homelessness in a clearly defined nonurban location, and 2) comparing the results to both urban and rural samples of homeless. The two studies selected for comparison have each been hailed as the leading research in their respective locations. First, Toomey and Rice’s (1990) Homelessness in Rural Ohio, has been called the “largest and most comprehensive study of homelessness in rural America” (Dahl et al. 1992). Although almost a decade old, the results of this study still serve as the foundation for present day discussions on rural homelessness (cf. Wright et al. 1998: 182-184).
Similarly, Burt and Cohen’s (1989; 1990) investigation of homelessness in a national sample of twenty urban areas with populations over 100,000, has been described as the “most comprehensive study of its kind” (Jencks 1994:10), as well as the “most methodologically sound” (Toomey et al. 1993: 23). As recently as 1998, the Urban Institute described this data set as the “most recent nationwide study of the urban homeless” available (Urban Institute 1999).2
Methodological variations in sampling techniques, however, should be noted. Burt and Cohen’s (1989; 1990) respondents were from homeless shelters and/or soup kitchens, while the rural data included people staying in shelters, inexpensive hotels and motels, or other unique transient locations (First et al. 1990 ; 1994). The use of non-shelter sources of the homeless is common in rural areas where there are fewer shelters and thus fewer visible homeless (Aron and Fitchen 1996; NCH 1997; Wright et al. 1998; NCH 1998).
The present investigation uses shelter residences only--the common denominator between the two other data sets3. Although the rural data’s inclusion of non-shelter residents may make data comparisons more difficult, Shlay and Rossi (1992) state that the majority of studies on the homeless use shelter residents as a criteria for inclusion, and Jencks (1993:13) concludes that “...the rate of shelter use is about the same in smaller communities as in big cities”. Further, respondents were asked if they knew other homeless people who did not stay at the shelter. Ninety-seven percent of the respondents said no. Nonetheless, estimates of the homeless from shelter populations may underestimate the numbers of the homeless and, thus, skew the resulting demographics.
Situated on the coastal plains of North Carolina4, Southern City had a population of 46,000 and a land area of 18.1 square miles at the time the survey was conducted. Serving as the regional center for commerce, health care, and education, Southern City is surrounded by several smaller communities with populations ranging from just over 5,000 to just less than 500. Dominated by agriculture in general, and tobacco and cotton production in particular, Southern City is the county seat--the county having a population of 108,000 with an unemployment rate of 5.5 in 1992.
Southern City’s homeless shelter was established in 1988 as a response to citizen complaints of a number of people “hanging around in the streets.” The shelter operates as a non-profit organization, supported by a variety of church-affiliated groups and volunteers from the community. Although small grants through the Federal Emergency Management Agency and United Way provide the bulk of the over $100,000 operating budget, much of the food provided to the residents comes from contributions by the U.S. Department of Agriculture and donations from local churches, restaurants, and private individuals. Non-food items such as bedding and clothes are exchanged with other facilities such as the County Family Violence Shelter.
The shelter is located in an abandoned elementary school, built in the 1950’s and located in an inner city black residential neighborhood. The “gymtorium” serves as the center of the facility. It is here that residents sleep in a barracks-like setting with access to bathrooms and showers, and limited access to a cafeteria. There are no admitting restrictions, although “trouble makers” are required to leave the shelter for the night.5 Facilities are sex-segregated with women and children sleeping on the stage behind a cloth barrier. The facility also contains an office, and sleeping quarters for the full-time Director and two part-time assistants. The shelter is open from 6:00 p.m. to 6:00 a.m.
Interviews of shelter residents took place in February and March of 1992, and were conducted by senior and graduate sociology students who had undergone several hours of faculty-lead sessions on interviewing techniques. All interviews were conducted at the shelter between 7:00 and 10:00 in the evening and were, with the participants permission, tape recorded. Each of the seven students was assigned ten of the seventy beds (although not necessarily occupied) located in the shelter and were responsible for interviewing residents in those beds over the course of a six week period. The days on which the interviews were conducted were determined by shelter activities i.e., no interviews took place on, for example, “clinic night” or “church night”. Hispanic residents were interviewed with the help of an interpreter. Forty-one residents were interviewed in total.
In addition to asking homeless-specific questions, standard demographic data were recorded (sex, race, age, number of children, marital status, education, and employment). Following Wright (1986: 228-229), percentage differences of ten or more were considered meaningful.
Table 1a: Characteristics of Homeless by Location
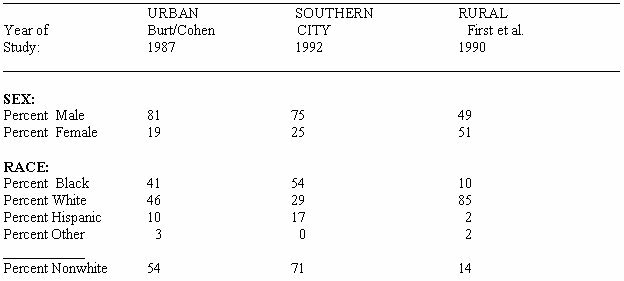
A. Numbers do not necessarily sum to 100 due to rounding error and/or missing data.
Table 1 reports demographic data from Southern City, as well as from the rural and urban samples. As in previous studies of the homeless, the majority of shelter residents were male --75 percent. The percentage of males and females is significantly different than that from the rural sample, but varies little from the urban data.
Females have traditionally made up a larger proportion of the shelter population than other homeless populations, for example, the soup kitchen population. Most research suggests that the over-representation of women in shelters is due to their need to care for dependent children (Vissing 1996; Burt and Cohen 1989; 1990; Butler 1997). While just over half of the respondents reported having children (57.1%), females (77.8 %) compared to males (52.0 %) were more likely to report so and to have their children with them at the shelter.
Southern City homeless shelter residents were predominantly non-white (71 %), a number significantly higher than the percentage of non-whites in the urban or rural samples. While approximately 34 percent of the county population is non-white, the disproportionately high rate of non-whites in the Southern City sample may be an artifact of the time of year in which the interviews were conducted--in the winter months. Of the 71 percent non-white residents, 54 percent were African-American and 17 percent Hispanics. Hispanics were more likely than any other racial/ethnic group to report being “farm laborers” (83%). Farm labor, like construction, the second most frequently reported work category, is seasonal and may have been responsible for the inflated number.
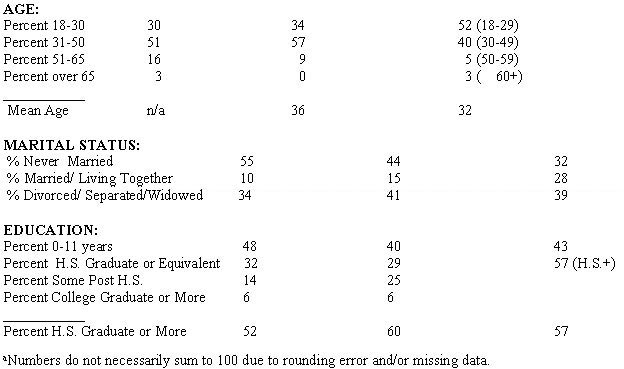
Consistent with both the urban and rural samples, the average age of shelter respondents was 36, with a median value of 34. As Rossi (1990:957) states, “...todays homeless are surprisingly young; virtually all recent studies of the homeless report median ages in the low to middle 30s”. Somewhat surprisingly, however, younger respondents were not more likely to report being first time shelter residents.
Southern City shelter residents were less likely to never be married (44 %) than their urban counterparts (55 %), but more likely than rural respondents (32 %). As Barak (1991:36) notes, the percentage of married people among the urban homeless is lower than that among the rural homeless. However, Southern City and urban data in other marital categories are comparable. Respectively, Southern City and the urban data indicate that 15 percent and 10 percent of the respondents were married or living together, and 41 percent and 34 percent of the respondents were divorced, separated, or widowed.
Over half of the Southern City respondents reported graduating from high school or higher levels of education (60 %) which is similar to the urban and rural samples. Educational levels varied little by sex, but were substantively interesting by race/ethnicity. Forty percent of the non-white respondents reported having less than a high school degree compared to 67 percent of the white respondents. Thus, in the present sample, minority shelter residents were better educated than their white counterparts.
Of the variables of interest, length of time homeless was the most difficult to compare across samples given differences in measurement intervals. Some respondents initially explained being unsure how long they had been homeless, reporting moving in and out of relatives and friends homes and abandoned houses. When asked how long he had been homeless one 39 year old white male responded, “Off and on. I would say approximately, you know, maybe a year and a half...two years.. maybe three.” (#7).
Table 2. Characteristics of Homeless by Location
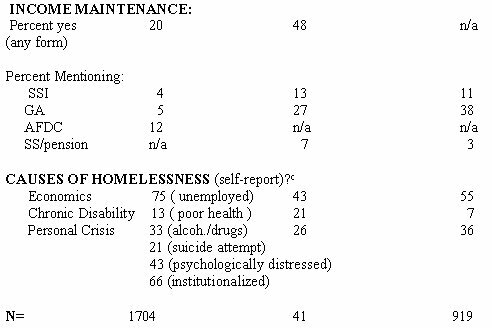
Table 2a. Characteristics of Homeless by Location
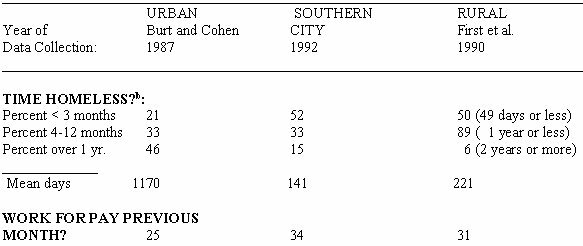
B. The urban and SoutheCrn City homeless were asked “How long have you been homeless?”. First et al. (1994) asked, “When was the last time you had a home or a permanent place to stay?”
C. Burt and Cohen (1989) asked respondents a series of questions about: 1) employment for pay in the last month, 2) self-reported health as excellent, very good, good, fair or poor, 3) suicide attempts (“Was there ever a time in your life when you felt so bad that you tried to kill yourself?”, 4) alcohol and drug involvement, 5) psychological distress as measured by a score of 16 or above on the CES-D scale, and 5) whether or not respondents had ever been institutionalized in a prison/jail, detoxification center, or mental hospital. Answers to these questions, although not dealing directly with the causes of homelessness, are conditions that could “impair their ability to become self-sufficient” (Burt and Cohen 1990, p. 31).
Table 2 continues the analysis of characteristics of urban, nonurban, and rural respondents. Southern City residents most often reported being homeless three months or less (52 %), followed by four to twelve months (33 %), and more than 12 months (15 %). Burt and Cohen’s (1989; 1990) research found that the modal interval was over a year (46 %) while 89 percent of the rural respondents report being homeless for a year or less. Mean days homeless indicate that time homeless is significantly greater in urban areas (1170 days), followed by rural (221 days) and nonurban areas (141 days).
Respondents in the rural and Southern City samples were asked whether they had worked for pay in the previous month. While rural and Southern City respondents varied little in the percent responding yes, 31 and 34 percent respectively, urban homeless respondents reported that 25 percent were “presently working”.
Income maintenance was measured by whether or not a respondent, at the time of the survey, was receiving Aid to Families with Dependent Children (AFDC), General Assistance (GA), Supplemental Security Income (SSI), or Social Security (SS)/ pension. A slightly higher than might be expected proportion of Southern City shelter residents received income maintenance benefits--48 percent---over twice the number receiving such benefits in the urban sample. However, when asked the type of benefit received, respondents in the nonurban and rural samples were most likely to mention General Assistance over any other type of benefit.
Finally, respondents were asked, “What do you think caused your homelessness?”6 Categories included chronic disability (mental and physical illness, substance abuse, institutionalization); personal crisis (divorce, runaway/throwaway, family conflicts, death of spouse); and economic conditions (loss of employment, lack of sufficient funds, eviction, and/or no transportation). Consistent with other research (cf. Momeni 1990:79), the modal category for the nonurban and rural samples is economic conditions (43 % and 55 % respectively). As one 30 year old black female responded (#15):
The reason I’m in this place is because I do not have a job. It is simply that. You have to have money to pay for those things and most people are staying here because they don’t have a job. If you had a job you could stay and save up money. No one wants to stay. The only people who have to stay here, some of the people like, have alcohol problems or something like that, and they can’t work but I don’t have any of those problems. There is no reason why I should not be able to work and get out of this shelter-none.
Chronic disability variables were the least likely to be mentioned in both the nonurban and rural samples. However, an examination of responses from the urban sample indicates that a fairly high proportion of respondents reported being in poor health (13 %) and receiving some form of institutionalized treatment at least once in their life (66 %).
The results, although re-affirming the heterogeneity of the homeless population and the need for consistent measurement techniques, also suggest that, contrary to Vissing (1996), Lawrence (1995) and Dahl et. al. (1992), the characteristics of the nonurban homeless reflect those of both comparison samples. The homeless in Southern City were predominantly nonwhite males, with an average age of 36. Most were never married, almost half did not graduate from high school and, on the average, had been homeless for four to five months. A third had worked for pay in the month prior to the survey, and almost half were receiving some kind of income maintenance.
The above portrait bears a remarkable similarity to Burt and Cohen’s (1989:36) description of urban respondents:
...homeless persons in cities with a population of 100,000 over....are male... the majority are non-white...between 30 and 51 years of age...[A]lmost half have not graduated from high school...
Southern City homeless were also disproportionately black, young, single males. However, similarities between Southern City homeless and First et al.’s (1990; 1994) rural sample also exist. Nonurban and rural homeless were less likely to be homeless for over a year, the mean days for rural and Southern City samples being 141 and 221 respectively. The mean number of days of homelessness for the urban sample was 1,170.
Further, the distribution of income maintenance between the rural and Southern City samples are similar--General Assistance being the most common form of aid in both samples. While comparisons of self-reported causes of homelessness are difficult given differences in the interview formats, educational levels appear analogous for all three groups with a range of only 52 to 60 percent completing high school and/or with some post-high school experience.
It is possible, however, that the variations in the characteristics of the homeless may, in part, be an artifact of variations in the three sampling designs. For example, Southern city homeless were exclusively from shelters. Some research suggests that women are more likely to seek refuge in shelters and, thus, the Southern City estimates of the number of homeless females may be exaggerated (Toomey et al. 1993). On the other hand, Vissing (1996) and First et al. (1994) suggests that homeless rural families, the highest proportion of which are headed by females, are more likely to stay with friends and family than in shelters which would suggest that the Southern City sample underestimated the number of homeless females. Given that 75% of the sample were men, the second interpretation appears more likely.
Additionally, as noted earlier, the proportion of non-whites was considerably higher than that in the urban or rural samples. It was suggested that the months in which the interviews took place--February and March--may have impacted the number of African Americans and Hispanics who were disproportionately migrant workers. State statistics support this contention. North Carolina farm worker service providers estimate that between 15 and 50 percent of all migrant workers spend at least some time in a shelter, most frequently in the winter month (North Carolina Consolidated Plan 1996). Further, the number of the homeless in Southern City could be overestimated and/or “urbanized” as the homeless migrate South from the harsh winters of the Northern states (Jencks 1994:1).
The shelter has grown considerably since the data were collected. As if in preparation for what lies ahead, the staff has more than doubled. Consistent with national trends there have been rumblings of funding cutbacks and moving the shelter to a different, i.e., less visible location. The National Law Center on Homelessness and Poverty recently published a report, Out of Sight, out of Mind?, which documents similar efforts to conceal the homeless through the relocation of shelters, nightly “sweeps”, and forcible removal from high visibility areas (Nieves 1998; Hsiao 1998. America 1999).
Such trends reflects a general movement toward what Hooper (1998) calls “remoralizing” the poor and, by extension, the homeless. The implication that the poor and homeless are some how accomplices in their own circumstances, that poverty is symptomatic of individual deficiency, is implicit in the Personal Responsibility and Work Opportunity Reconciliation Act of 1996, which subordinates need to merit. Ironically, many of the same people who have been denied welfare assistance are now homeless and, once again, are being penalized for their poverty. For example, New York City officials have declared that shelters are a form of public assistance and, therefore, shelter residents must meet the requirements of all public assistance recipients including workfare (Bernstein 1999:1).
The effects of welfare reform are, and will continue to be, disproportionately felt in rural areas where homelessness is most closely linked to poverty and there are fewer shelters and other services to compensate for the loss of welfare benefits (Aron and Fitchen 1996; Butler 1997; NCH 1998; Wright et al. 1998). In Wisconsin, a largely rural state, a 75 percent reduction in welfare recipients has resulted in a three-fold increase in the homeless population (DeParle 1999; Willis 1997a; Stanfield 1997); and in Maine, a five year limit on welfare benefits has increased homelessness in a state “where welfare has kept many [of the respondents] one step away from life on the streets” (Butler 1997: 432).
Thus, while government officials, as indicated by the policies they initiate, pursue the path of least resistance by blaming the victim, homeless advocates continue to call for structural alterations, most notably the reduction of poverty and an adequate supply of low- income housing (Wright et al. 1998: 210). Ultimately, homelessness is a problem of poverty and in areas where poverty rates are the highest, often nonurban areas, homelessness will continue to increase particularly with the removal of the safety net of public assistance. The need to count and classify, describe and define, hence remains paramount in identifying the causes of homelessness in the hopes of developing public policies that work.
America. 1999. “More Homeless, More Hungary.” America 180 (3): 3.
Applewhite, Steven Lozano. 1997. “Homeless Veterans: Perspectives on Social services Use. “ Social Work 42 (1): 19-31.
Aron, Laudan Y. and Janet M. Fitchen. 1996. “Rural Homelessness: A Synopsis” in Homelessness in America 1996. National Coalition for the Homeless. Washington, D.C.: Oryx Press.
Barak, Gregg. 1991. Gimme Shelter N.Y: Praeger.
Bernstein, Nina. 1998. “New York City Plans to Extend Workfare to Homeless Shelters.” New York Times (February 20): 1.
Burt, Martha and Barbara E. Cohen. 1989. America’s Homeless: Numbers, Characteristics, and Programs that Serve Them.” Washington, D.C.: The Urban Institute Press.
Burt, Martha and Barbara E.Cohen. 1990. “A Sociodemographic Profile of the Service-Using Homeless: Findings from a National Survey. “ Pp. 17-38 in Homelessness in the United States--Data and Issues, edited by Jamshid Momeni. N.Y.: Praeger.
Butler, Sandra Sue. 1997. “Homelessness Among AFDC families in a Rural State: It is Bound to get worse.” Affilia 12 (4): 427- 441.
Dahl, Sherlyn, Helen Harris and Joanne Gladden. 1992. “Homeless ness: A Rural Perspective.” Prairie Rose (August):1-6.First, Richard, John Rife, and Barbara Toomey. 1994. “Homeless ness in Rural Areas: Causes, Patterns, and Trends.” Social Work 39 (1): 97-108.
DeParle, Jason. 1999. “Wisconsin Welfare Overhaul Justifies Hope and Some Fear. “ New York Times (January 15): A1.
Department of Health and Human Services. 1998. “National Survey of Homeless Assistance Providers and Clients.” HHS Homepage. <http://www.dhhs.gov>
First, Richard, John Rife, and Beverly Toomey. 1994. “Homelessness in Rural Areas: Causes, Patterns and Trends.” Social Work 39 (1): 97-108.
First, Richard, Beverly Toomey and J. Rife. 1990. Homelessness in Rural Ohio. Columbus, Ohio: Ohio State University.
Fitchen, Janet M. 1991. “On the Edge of Homelessness: Rural Poverty and Housing Insecurity.” Rural Sociology 57 (2) 173-193.
Hambrick, Ralph S. And Gary Johnson. 1998. “The Future of Homelessness.” Society 35 (6): 28-38.
Hewitt, M. 1989. “Defining ’Rural’ Areas: Impact on health care policy and research.” Washington D.C.: Community for Creative Non-Violence.
Hsiao, Andrew. 1998. “The Disappeared.” The Village Voice 43 (49): 32-33.
Hopper, Kim. 1998. “Housing the Homeless.” Social Policy 28 (3): 64-67.
Jencks, Christopher. 1994. The Homeless. Cambridge, MA: Harvard University Press.
Lawrence, Mark. 1995. “Rural Homelessness: A Geography without a Geography. Journal of Rural Studies 11 (3): 297-301.
Momeni, Jamshid. 1990. “No Place to Go: A National Picture of Homelessness in America.” Pp. 165-183 in Homelessness in the United States--Data and Issues, edited by Jamshid Momeni. N.Y.: Praeger.
NAEH (National Alliance to End Homelessness). 1998. “Facts about Homelessnss.” National Alliance to End Homelessness 1518 K Street, Washington, D.C. <http://www.naeh.org>
NCH (National Coalition for the Homeless). 1999. “Who is Homeless?: Fact Sheet No. 3”. February. 1012 14th Street, NW. Suite 600. Washington, D.C. 20005. 202/73775-6444.
_____.1998. “How many Homeless: Fact Sheet No. 2”. May. 1012 14th Street NW. Suite 600. Washington, D.C. 20005. 202/73775-6444.
_____. 1997a. “Rural Homelessness: Fact Sheet Number 13”. October. 1012 14th Street, NW. Suite 600. Washington, D.C. 20005. 202/73775-6444.
_____. 1997b. “Homelessness in America: Unabated and Increasing.” 1012 14th Street, NW. Suite 600. Washington, D.C. 20005. 202/73775-6444.
National Law Center on Homelessness and Poverty. 1996. “Mean Sweeps: A Report on Anti-Homeless Laws, Litigation and Alternatives in 50. United States Cities.” National Law Center on Homelessness and Poverty. 918 F Street, NW, Washington, DC 20004 202/638-2535.
National Rural Health Association. 1996. “The Rural Homeless: America’s Lost Population.” Kansas City: NRHA #PU0896-42.
Nieves, Evelyn. 1998. “Homelessness Tests San Francisco’s Ideals.” New York Times (November 13): A1.
North Carolina Consolidated Plan. 1996. “Housing Needs Assessment: Homeless Needs, Facilities and Services.” November. Washington D.C.: U.S. Department of Housing and Urban Development. Office of Community Planning and Development. <http:www.state.nc.us/commerce/commasst/plan>
Oreskes, Michael and Robin Toner. 1989. “The Homeless at the Heart of Poverty and Policy .” New York Times (January 29).
Priority Home! 1994. “The Federal Plan to Break the Cycle of Homelessness.” Interagency Council on the Homeless. Washington, D.C.: Government Printing Office.
Reganick, Karol A. 1997. “Prognosis for Homeless Children and Adolescents.” Childhood Education 73 (3): 133-136.
Rossi, Peter H. 1989. Down and Out in America: The Origins of Homelessness. Chicago, Il.: University of Chicago Press.
Shinn, Marybeth. 1997. “Family Homelessness: State or Trait?” American Journal of Community Psychology 25(6): 755-770.
Shlay, Anne B. and Peter Rossi. 1992. “Social Science Research and Contemporary Studies on Homelessness.” Annual Review of Sociology 18: 129-160.
Snow, David and Leon Anderson. 1993. Down on their Luck: A Study of Homeless Street People. Berkeley: California University Press.
Snow David, Susan Baker, Leon Anderson, and Michael Martin. 1986.”The Myth of Pervasive Mental Illness Among the Homeless.” Social Problems 33 (5): 407-423.
Sosin, Michael. 1992. “Homeless and Vulnerable Meal Program Users: A Comparison Study.” Social Problems 39 (2): 170-188.
Stanfield, Rochelle. 1997. “HUD Choice may Face Old Problems.” National Journal 28 (3): 120-122.
Statistical Abstract of the United States, 118th edition. 1998. Washington, DC: Government Printing Office.
Toomey, Beverly, Richard First, Richard Greenlee and Linda Cummings. 1993. “Counting the Rural Homeless Population: Methodological Dilemmas.” Social Work Research and Abstracts 29(4):23-27.
U.S. Conference of Mayors. 1998. “A Status Report on Hunger and Homelessness in American Cities. “ U.S. Conference of Mayors. <http://www.usmayors.org/uscm/>
U.S. Department of Agriculture, Rural Economic and Community Development. 1996. “Rural Homelessness: Focusing on the Needs of the Rural Homeless” U. S. Department of Agriculture, Rural Housing Service, Rural Economic and Community Development, 14th St. and Independence Ave. SW. Washington, DC 20250-1533.
Urban Institute. 1998. “Homelessness: Ten Basic Questions Answered.” <http://www.urban.org/news/ factsheet/homelessFS.html>
Vissing, Yvonne M. 1996 Out of Sight, Out of Mind. Lexington: University of Kentucky Press.
Willis, Laurie. 1997a. “Grim Forecast for Needy.” News and Observor. December 5: B1.
Willis, Laurie. 1997b. “Conference to Focus on Homeless.” News and Observor. December 4: B7.
Wright, James D., Beth A. Rubin and Joel A. Devine. 1998. Beside the Golden Door. New York: Aldine.
Wright, S. E. 1986. Social Science Statistics. Newton, MA: Allyn and Bacon, Inc.
1. Obviously, any given individual's homelessness has multiple causes. Nonetheless, the debate over causality has most often been framed as one between structural versus individualistic variables or what Shinn (1997 ) calls "states versus traits". Wright et al. (1998) proposes an intermediate and theoretically sound position: "defects and dislocations of the social structure ...create a population at risk of homelessness; defects of persons determine who within the at-risk population actually becomes homeless" (p. 9).
2. A more recent survey, the 1996 National Survey of Homeless Assistance Providers and Clients, was modeled after the Burt and Cohen (1989) study. Its emphasis, however, unlike its predecessor is on the providers of homeless assistance and the clients they serve (Department of Health and Human Services 1998).
3. Southern City does not have a soup kitchen or any other assisting services with the exception of the Salvation Army which, if called by the police, accompany the homeless person to the shelter.
4. According to the North Carolina Consolidated Plan (1996), homelessness in the state varies by geographical region. The most populated area of the state, the Piedmont, has the highest rate of homeless followed by the coastal plains and the mountains. Statistics from 1994, those that most closely approximate the study date, indicate that North Carolina had 187 emergency shelters with a sleeping capacity of 4,271 in 64 of the state's 100 counties. As in other states, homelessness in North Carolina is predicted to grow with a 1997 estimate of over 500,000 North Carolinians on the verge of homelessness (Willis 1997b).
5. Several city police were interviewed, as was the police attorney, in reference to police policy concerning the homeless. Police indicated that on any given night, the shelter was the location of an estimated 90 to 100 percent of the homeless in the city limits. Police, when coming upon a homeless person, drive the person to the shelter if so desired, or simply make sure that the person "moves along" since there is a policy of "no sleeping" in public parks at night, or in alleys, streets, or sidewalks. Additionally, the shelter director and staff members were interviewed concerning shelter policy and history.
6. Burt and Cohen did not ask for self-reported causes of homelessness. They did, however, ask about employment, health concerns, institutionalization (prison/jail, mental hospital, drug/alcohol treatment facility), psychological distress, and attempted suicide.
Copyright 1999 Electronic Journal of Sociology