This paper places Project Magellan within the larger semantic differential tradition. We illustrate how Heise (1997) improved the first-generation paper-and-pencil techniques for producing more highly reliable and valid semantic differential data with ATTITUDE, a Pascal-based computer program that was much more efficient, less costly and useable with non-romanized languages like Japanese and Chinese. Project Magellan produces a third-generation improvement on the collection of semantic differential data with Surveyor. To illustrate the advantages and challenges produced by switching over to Surveyor, we compare our use of Surveyor to our experiences with ATTITUDE. First, we describe our successes and failures in the 1990s using ATTITUDE in Japan, and from 1999 to 2001 in China, from which we draw out four practical lessons for improving cross-cultural research with Surveyor. Then we show that Surveyor, in spite of its advantages for collecting affective meaning data in any culture, does produce significantly more data shrinkage than ATTITUDE, due to the fact that it may be used with complete anonymity via the World Wide Web. We offer five practical suggestions for making Surveyor the affect data collection instrument-of-choice.
This paper is meant to be a companion to an earlier report by Heise (2000b), available at https://sociology.org/content/vol005.003/mag.html. That paper details the latest generation instrument for collecting affective meanings in any language, Surveyor. This new instrument has the potential for collecting semantic differential-type data with high reliability and validity anywhere in the world via the Internet.
The Surveyor methodology rests on classic semantic differential studies demonstrating that three universal dimensions underlie human affect (Osgood, 1964). The three dimensions – evaluation, potency, and activity – are usually referred to by the acronym of EPA. Meta-analyses (Collins and Kemper 1990) confirm that these three dimensions underlie all human microinteraction. Evaluation (e.g., good-bad, nice-awful) ratings measure the latent variable of status; potency (powerful-impotent, big-little, tall-short) ratings measure power; and activity (lively-slow, active-inactive, energetic-lethargic) is now viewed as operationalizing social spontaneity (Heise 2000a).
The original research by Osgood and his collaborators was based on pan-cultural factor analyses across more than two dozen societies. Osgood, May and Miron (1975) found strong evidence that all humans evaluate similar concepts with the same three EPA dimensions. Heise (2000a) demonstrates that people in different cultures share remarkably similar sentiments for basic concepts like the five basic emotions shown below, in spite of obvious cultural differences in mean ratings. Note that Americans, Japanese and Chinese rate the concept of “happiness”, for instance, as good and potent in spite of variation in ratings. There is even less variation in ratings of “sadness” and “anger” by indigenes of the same three cultures for these same two dimensions.
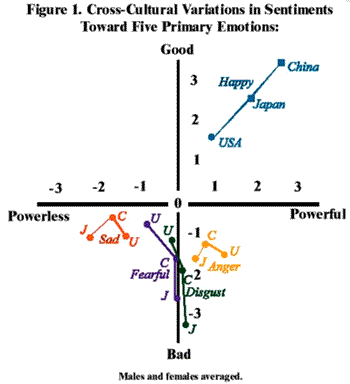
Figure 1. Cross Cultural Variations in Sentiments toward Five Primary Emotions.
More importantly, Heise (2002) and Mackinnon and Luke (1996) go a step further in demonstrating why such sentiments should be called fundamental sentiments: most EPA profiles are highly resistant to change over generations. When fundamental sentiments do change, they appear likely to reflect changes in a society’s culture and social structure. Also, they are resistant to change because they provide the cognitive frames and affective meanings that make social interaction possible.
The Japanese version of the semantic differential used through the 1990s, called TAIDO (= ATTITUDE), is shown in the Figure 2. This particular graphic shows the rating of “Watakushi = ‘I, Me’” for the Japanese activity scale (left to right: active-inactive, fast-slow, young-old).
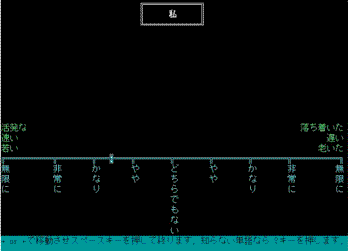
Figure 2. Typical Japanese Screen Display of MS-DOS program ATTITUDE.
ATTITUDE (Heise 1997) was the first computer program designed to overcome the laborious problems created by the use of paper-and-pencil versions of the semantic differential. The first-generation paper-and-pencil versions presented subjects with roughly 12 bipolar scales to rate per stimulus, thereby creating needs for unwieldy quantities of paper and ink, and the inability to rate more than a fraction of the number of stimuli possible to rate with ATTITUDE. For example, to produce the minimal lexicon of 1500 American concepts referred to in Heise (2001) would consist of over 1 million individual ratings and require at least 90,000 letter-size pages with traditional paper-and-pencil techniques. ATTITUDE reduced this volume to slightly over one-fourth that many electronically registered ratings without concurrent problems of errors in transferring informant ratings. Furthermore, the randomization of stimuli and scales in ATTITUDE greatly reduced known problems with paper-and-paper techniques, such as extremity- and acquiescent biases. The result was an improved method over Osgood’s original semantic differential with near-interval scaling properties and exceptionally high reliability and validity (Smith-Lovin 1987:44).
In spite of the successes of ATTITUDE as a second-generation technique for measuring affective meanings, it was based on the older PASCAL language, now close to obsolete and difficult to compile into non-romanized languages. Consequently, Heise (2001) created a third-generation update of the semantic differential, termed Surveyor. This update was written and compiled in JAVA 2.0 using UNICODE characters that make it useable to collect affective meaning data in any human language.
We are the first researchers to collect non-Romanized data with Surveyor. Our pioneering use suggests that other researchers need to be aware of opportunities and drawbacks related to indiscriminate use of Surveyor. Simply put, Surveyor is not a panacea for the collection of affectual data cross-culturally. To illustrate the advantages and challenges of switching over to Surveyor, we compare our use of Surveyor to our experiences with ATTITUDE,. We offer tentative suggestions for making Surveyor the affect collection instrument-of-choice for affective meaning.
During the 1990s, two of us (Smith and Ike) translated and backtranslated an MS-DOS and WINDOWS-based version of ATTITUDE (1997) into a Japanese version called TAIDO (1995). We employed bipolar indices derived a half-century earlier by rigorous psychometric methods (Kumata 1957; Osgood 1964)
Virtually the entire Japanese lexicon2 and all of the Japanese equations (>http://www.indiana.edu/~socpsy/ACT/interact/JavaInteract.html) in the affect control theory simulator were collected on 3 and ½ inch diskettes during the 1990s using TAIDO. Typically, the senior author would reserve a room with approximately 30-40 computers under the auspices of a collaborating university in Japan. Colleagues at the university recruited approximately 30 male and 30 female cultural informants from their classes to rate up to 150 stimuli per session over the three universal dimensions of evaluation (status), potency (power), and activity (agency) (Collins and Kemper 1990). Informants averaged between 30 and 50 minutes to make up to 450 ratings. This averages to one rating every 5 to 7 seconds. Normally at least two Japanese graduate students accompanied the senior author in the computer room at all times to answer questions that might arise, and to proctor the task.
We never paid the Japanese informants for their time in creating the 1800-entry lexicon (Heise 2000b) or numerous equations (Smith, Matsuno et al. 1994; Smith, Umino et al. 1997; Smith, Matsuno et al. 2001). Normally the senior author gave a brief explanation in Japanese to prospective informants in large classes focusing on our desire to test the American model of affect control cross-culturally. To motivate informants to take the rating task seriously, the senior author appealed to the curiosity of the university students about differences between Americans and Japanese, and men and women. About half of the informants were given extra credit remuneration by each collaborating professor as added incentive.
In retrospect, we had high cooperation and few problems in data collection for several reasons. First, computers were a true novelty for undergraduate use in Japan at the time, and students were anxious to gain experience in their use. Second, both the colleagues of the senior author and their students found ATTITUDE to be a fresh and scientifically precise way of expressing their attitudes compared to traditional paper-and-pencil tests. Most of the students already had taken research methods or statistics courses and were piqued by the randomization of scales and stimuli presentation. Our informants often asked if they could invite their friends to future rating sessions. The upside is that close to 1600 Japanese university students have gladly participated in producing the Japanese lexicons and equations to date.
ATTITUDE did, however, have its limitations. First, it could only be used on a truly MS-DOS or WINDOWS-compatible machine, and it had to be recompiled frequently to function with specific Japanese font systems. This presented problems during the first half of the 1990s when many Japanese universities used primarily Japanese-made computers with proprietary operating systems not compatible with MS-DOS or WINDOWS. We could never be sure if TAIDO would work at a particular university, so we had to test recompiled TAIDO programs prior to conducting research – a truly laborious task.
After 1995, as Japanese WINDOWS machines became the norm, the senior author found it increasingly difficult to obtain permission to take over an entire university computer lab for the three or four days needed for actual data collection. Student demand for campus computers had simply outstripped the ability of administrators to provide them at most of the collaborating institutions. As the decade wore on, machines with three-and-a-half inch diskette drives became increasingly obsolete, creating pressure to find alternative ways to use TAIDO through the use of hard drive installations. This produced new challenges because computer administrators were reluctant to chance the spread of viruses. In fact, TAIDO does not work on the present generation of Japanese Windows 98 machines. We were forced to scavenge an older generation machine to make copies of the TAIDO graphics in this paper.
Of the roughly 1600 Japanese informants surveyed using TAIDO, roughly five percent (less than 100 informants in total) did not take the task seriously. The rare informants who tried to subvert data quality with either random or nearly neutral responses across the stimuli sets were easily monitored. Usually such informants “cheated” by moving the cursor off of the neutral point (±.01 to .02 points) on a scale ranging from –4.3 to 4.3, and finished the rating task in less than 15 minutes. That is, they produced a rating every two to three seconds by making nearly all of their responses near neutral.
In 1998, the senior author commenced replication and extension of his Japanese affect control research to China. As a first task, ATTITUDE was translated and compiled for WINDOWS machines with Chinese fonts and renamed as TAIDU with the assistance of Mr. Chaofeng Wang and Ms. Yi Cai. Ms. Cai also drew up a list of crucial Chinese identities, behaviors, traits, emotions and settings based on two prerequisites. First, the senior author stipulated that the stimuli must represent the broad institutional categories of (1) informal relationships (friend, pal); (2) family (mother, father, son); (3) law and deviance (judge, lawyer, burglar); (4) commerce (airline pilot, CEO); (5) politics and military (bureaucrat, general); (6) academia (professor, student); (7) medicine (surgeon, patient); and (8) religion (Christian, Buddhist, atheist). The second requirement was based on the need to have a representative sampling of each of the eight EPA prototypes - from +,+,+ (good, potent, active) to -,-,- (bad, impotent, inactive) - to form the Latin square designs necessary to derive the equation underlying all affect-control models. These stipulations were based on known EPA means for Japanese, Americans, Canadians, Irish and Germans. The senior author requested only Chinese translations where a good translation could be made.
Ms. Yi Cai then pared down the initial translations to a short list of 450 identities, 300 behaviors, 99 emotions, 150 settings, and 150 traits that appeared to satisfy those two requirements. Various Chinese graduate students and professors at Fudan University helped in the translation and backtranslation process. All candidate stimuli for inclusion were pretested with convenience samples of Fudan undergraduate students to make sure they understood the stimuli well enough to rate them. Lexical stimuli files were then produced for use with TAIDU. In total, the Shanghai-based lexicon now consists of 599 identities, 450 behaviors, 99 emotions, 216 traits, and 150 settings by using this methodology.
We attempted to follow procedures already outlined for administration of TAIDU as per the Japanese experience. The experience of TAIDU mirrored that of TAIDO. First, we found that TAIDU had the disadvantage of having to be compiled for specific computers on- and off campus due to lack of (then) uniform standards for Chinese fonts on Windows 98 systems. We also had trouble scheduling adequate numbers of workable computers due to student demand for their academic needs. However, over a two-week period we produced means and standard deviations for the 1150 entry lexicon (outlined above) with one problem: some stimuli like “Communist Party leader” proved too politically sensitive to release publicly.
Preliminary data analyses showed that TAIDU produced adequate intersubjective mean ratings, as measured by equivalent or smaller standard deviations than those produced by the American or Japanese lexical equivalents. As part of the preliminary analyses, the senior author q-factor analyzed this lexical data.4 We concluded that between 8 and 33 percent of this data lacks intersubjectivity and should be discarded. The problem of bad data is most acute with the Shanghai men.
Unlike the Japanese case, it was necessary to pay all of the Chinese raters the equivalent of about $4 per set of 150 lexical stimuli. Further, early on in the research when some Chinese males appeared to be producing nonsense data, the senior author found it necessary to ask the professor in charge of the students and several Chinese proctors to “weed out” the troublemakers and to make appeals to informants to take the rating tasks seriously if they wanted to be paid.
Part of the problem with using TAIDU in China is that the senior author was never able to secure the same collegial relationships as in Japan to underwrite the research. We recommend that anybody attempting to use TAIDU, TAIDO, ATTITUDE, Surveyor or their variations:
Producing Indigenous Surveyors. Around 2000, Dave Heise informed a number of researchers interested in collecting affective meaning data that he had an English prototype of Surveyor ready for pretesting. The senior author produced a stimuli file in English and began pretesting Surveyor by offering extra credit in his Introduction to Social Psychology classes as an educational experience directly related to his lectures. Over the course of two semesters, roughly 100 students from that class participated in either the pretest or the actual data collection referred to in Heise (2001). Unlike most other uses of Surveyor (to be discussed later), it appears as if none of these particular data sets suffers from the shrinkage problems referred to with ATTITUDE-based research.6 In fact, students of the senior author who participated often reported a concern that their own data did not “mess up” analyses given what they had learned about the affect control project in class.
Around the start of 2001, therefore, the senior author asked the two junior authors of this paper if they would help him produce versions of Surveyor for Japanese and Chinese indigenes. Li Ying invested close to 30 hours of labor into learning the mechanics of applying the Surveyor documentation (available on the Web at: http://www.indiana.edu/~socpsy/ACT/SurveyorDocumentation.htm) to produce the current Simplified Mandarin version of Surveyor. Likewise, Prof. Shuuichirou Ike agreed to produce the indigenous Japanese version. He has committed close to another 30 hours to producing all Japanese Surveyor instructions and interface files. Both the senior author and Prof. David Heise have likewise committed close to the same amount of time to checking each revision, compiling Java programs, and other tasks necessary to ensure a quality product.
Translating the interface files into html or java is by no means a simple task. Unlike HTML editors, what you see on the computer screen when producing UNICODE-based interface files is not what appears onscreen in Surveyor once loaded on an Internet browser. For example, the Japanese period appears at the end of Japanese sentences as “\u3002”. The UNICODE line of the computer code to rate “afraid” in Japanese is “\u6016\u304c\u3063\u3066\u3044\u308b\u3002”,”afraid”.
. This abstractness makes it necessary to painstakingly check and pretest the indigenous Surveyor files for grammatical mistakes and misspellings (or their equivalents) before use with actual informants.
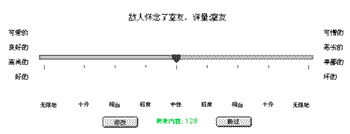
Producing a polished indigenous version of Surveyor in a non-Roman language requires dedication to numerous details listed in the 18-page Surveyor documentation. The senior author has lost track of the number of times that Dave Heise, Ying Li, Shuuichirou Ike and he were forced to check, recheck, redo and reload particular interface pages to get to the final Japanese and Chinese products. Of course, the tradeoff is a well-documented Surveyor instrument and stimuli files ready for use in future replications or new studies in any culture. An example of the Chinese version of Surveyor follows for the Chinese goodness scale for rating the object-person portion of an ABO sentence:
Lessons in Data Collection. Surveyor is not a panacea for collecting affective meanings cross-culturally. David Heise, Adam King, Andreas Schneider and the senior author have independently noted at least double the data shrinkage problem with the anonymous use of Surveyor versus ATTITUDE. All of us report that we lose at least one-in-ten data sets. This is partly a trade-off of the anonymity built in so that Surveyor conforms to current IRB-guidelines for protecting the confidentiality of subjects.
The following procedures can help cut down on data shrinkage:
Figure 1 illustrates the relationship between time elapsed while making 450 ratings and communalities. The figure reveals that there is no correlation between time taken on the task and communalities7 (i.e., after discounting conscientious outliers who took well over an hour). Clearly some informants take less than 20 minutes for 130 stimuli yet provide intersubjective data.8
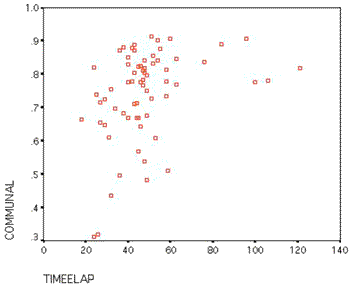
Figure 1. Scattergram of Communalities Plotted by Actual Time Taken to Make 450 EPA ratings in the Chinese ABO study.
Independently, Adam King, Dave Heise and the senior author have come to the conclusion that q-factoring using principle-components suitably operationalizes intersubjectivity or cultural homogeneity. Our current procedure is to:
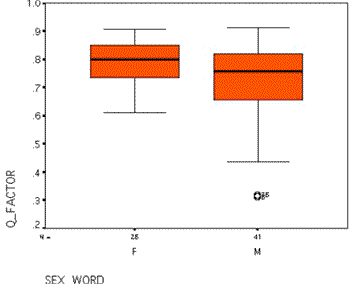
Figure 2. Box Plot of Q-Factored Communalities in the 2001 Chinese ABO Study by Sex of Informant.
How should one decide what is an acceptable cut-off value for differentiating conscientious from careless raters? Figure 2 partially answers this question with a display of a typical box-plot of communalities for the Chinese men and women who participated in a 2001 impression-management study. Although this figure displays data for only one of the six stimuli files used in the 2001 Chinese ABO study, all of the other five files produce nearly identical results. First, note that women have much smaller ranges and quartiles. Second, the problem with carelessness is primarily with male informants in all of the six data sets. (The senior author has shown this is also true for Chinese data collected using TAIDU.)
Experiments by the senior author with various cutting points indicate that communalities above .6 produce dramatically improved equation estimation in the Chinese data. For example, by discarding cases with communalities equal to or lower than .6, the estimations of r-squares improved from .5 to .72 for the potency of modifiers and identities, and from .6 to .75 for the activity of the same word combinations .
About 5% of the Chinese female data – and 12% for males – is lost using a .6 communality cut-off point. Thus, we recommend that users of Surveyor oversample with designs of 35 women and 40 men per stimuli set in order to reach an average of 30 male and 30 female cases per rating. This should allow setting the cutoff point as high as .65 or .70 in most cases. The tradeoff in oversampling (i.e., to produce higher r-squares in equations and more intersubjective lexicons) appears well worth the time and money.9
Using this kind of cut-off point appears to solve another problem created by the anonymous use of Surveyor: the indiscriminant use of 4.3 and –4.3 end points by some careless informants who do not use our instructions to drop items they are not able (or do not care) to rate. In the unfiltered Surveyor data, every variable has ranges of –4.3 to 4.3, which is created by about five percent of the anonymous informants. Filtering out those respondents who haphazardly chose extreme responses through a .6 or lower communality cut-off point produces much better r-squares in the production of the impression-management and amalgamation equations. For example, throwing out these clearly anti-cultural cases raised r-squares 44% (from .5 to .72) for the Chinese amalgamated activity equations. The comparable potency equation’s predictive power was raised .23%.10
Furthermore, use of the > .6 cut-off point for communalities produces average EPA standard deviations for the impression-management data dimensions of 1.6, 1.9 and 1.9 for females, and 1.8, 1.9 and 2.0 for males, which indicates only slightly lower intersubjectivity among Chinese raters than Japanese raters.
Advantages of Surveyor. In spite of the above cautions and recommendations, Surveyor has clear advantages over ATTITUDE-based data collection methods. Perhaps the most significant advantage of Surveyor is that it may be used on any computer connected to the Internet with a Java 2 capable browser. No longer does the researcher have to worry about recompiling for specific operating systems and font packages. This means that Surveyor may be used in isolated places like the Australian Outback - rather than just a particular classroom in an urban university setting – although we believe it still needs to be used with the most highly intersubjective informants in any particular culture or subculture. Ying Li, for example, rented an Internet café for a few hours in order to collect Chinese data when it became clear that some student participants were not taking the assignment seriously. If computing facilities are not available on campus, it is often easy to find a nearby enterprising Internet café manager more than willing to profit from the use of his or her facilities. Similarly, one might take laptop computers into an isolated Hogan on an Indian reservation to collect data that are sent to the data storage server via satellite.
Furthermore, we have lost no data to date sent halfway around the world to the Indiana University server that currently stores our data sets. Previously, up to 30% of the data on three-and-a-half inch diskettes were lost due to hardware problems in Shanghai in May and June of 2000 (using TAIDU), and all of the data were lost for one class at Teikyo University a few years ago with TAIDO. Thus, by following the procedures suggested earlier, Surveyor appears to offer a method for more efficient, reliable and valid collection of affective meaning data among indigenes of any culture.
Finally, the data are easily read into SPSS, SAS and other statistical programs as text-only data. Here is a sample of the first few comma-delimited lines of data from one of our Chinese projects:
1010632047, ““, “Fudan2001_1”, 0, 32, “Female”, 0
“CHRISTIAN counseled conformist”, -1.28, 1.24, 0.82
“FLATTERER protected thief”, -3.28, -4.3, 1.0
“RIVAL provoked intellectual”, -2.94, -1.46, -1.26
The first line always has an anonymous ID (so that respondents cannot be identified), the data set rated, the number of dropped items, the time taken to complete the task, sex of the rater (female/male), and sex of rater as a dummy variable (0/1) in the Shanghai data. This is followed by each translated sentence with the part rated displayed in UPPERCASE, followed by the EPA ratings for each respondent. Unlike ATTITUDE- based analysis, Surveyor data sets are essentially ready for analysis as soon as they are sent to the proper Directory.
The main problem with Surveyor is data shrinkage. However, we have isolated the problem and offered suggestions as a means of reducing data shrinkage. This paper offers nine practical suggestions for using Surveyor to collect affectual meaning data as a replacement for early generation semantic differential instruments. Ultimately, our goal is to reduce shrinkage to the point that the researcher need not throw out data. Nevertheless, Surveyor now incorporates a semantic differential instrument that may be used to collect data from any culture in any indigenous language with greatly increased reliability and validity compared to previous paper-and-pencil versions.
Collins, R. and T. D. Kemper (1990). “Dimensions of Microinteraction.” American Journal of Sociology 96: 32-68.
Heise, D. R. (1997). ATTITUDE. Bloomington, IN. 1997 http://www.indiana.edu/~socpsy/ACT/interact/JavaInteract.html Retrieved February 20.
Heise, D.R. (2000a) “Affect Control Theory across Cultures. Paper presented at “Theory Section Miniconference: New Directions in Sociological Theory: Growth of Contemporary Theories,” Annual Meetings of the American Sociological Association, Washington, DC, August,
Heise, D. R. (2000b). JavaInteract 2.0. http://www.indiana.edu/~socpsy/ACT/interact/JavaInteract.html. Retrieved November 23, 2001.
Heise, D. R. (2001). “Project Magellan: Collecting Cross-Cultural Meanings Via the Internet.” Electronic Journal of Sociology 5(3): http://https://sociology.org/content/vol005.003/mag.html.
Ike, S. (1995). TAIDO. [MS-DOS and WINDOWS based software] Tokyo, Teikyo University, Dept. of Sociology.
Kumata, H. (1957). A Factor Analytic Investigation of the Generality of Semantic Structure across Two Selected Cultures. Psychology. Champaign-Urbana, IL, University of Illinois.
Mackinnon, N.J. and A. Luke. (1996) “Changes in Cultural Sentiments for Social Identities as Reflections of Social and Cultural Changes.” Paper presented at the American Sociological Association, New York, August.
Osgood, C. (1964). “Semantic Differential Technique in the Comparative Study of Cultures.” American Anthropologist 66: 171-200.
Osgood, Charles E., William H. May, and Murray S. Miron. 1975. Cross-Cultural Universals in Affective Meaning. Urbana: University of Illinois Press.
Romney, A. Kimball, Susan C. Weller, and William H. Batchelder. 1986. “Culture as Consensus: A Theory of Culture and Informant Accuracy.” American Anthropologist 88:313-38.
Smith, H. W., T. Matsuno, et al. (2001). “The Social Construction of Japanese and American Versions of Attributional Principles.” Social Psychology Quarterly 64: 180-194.
Smith, H. W., T. Matsuno, et al. (1994). “How Similar Are Impression-Formation Processes Among Japanese and Americans?” Social Psychology Quarterly 57: 124-39.
Smith, H. W., M. Umino, et al. (1997). “The Formation of Gender-Differentiated Sentiments in Japan.” Journal of Mathematical Sociology 22: 373-95.
Smith-Lovin, L. (1987). “Impressions from Events.” Journal of Mathematical Sociology 13: 35-70.
1. The senior author is grateful for support from two Fulbright Commission grants in 1989 and 1995, and a University of Missouri Research Board grant in 1998 without which the Japanese data could never have been collected. Professors in Japan who graciously provided the majority of student informants include Michio Umino (Tohoku University), Takanori Matsuno (Showa Women’s College), Akinori Okada (Rikyo University), Shuuichirou Ike (Teikyo University), Nozomu Matsubara (Tokyo University), Kazuto Oshio (Japan Women’s University), and Hisako Yanaka (Kyoritsu Women’s College).
2. Currently the Japanese lexicon consists of 666 identities, 350 behaviors, 350 trait dispositions, 300 settings, and 101 emotions.
3. All of the Chinese data were collected under a 1998 National Science Foundation grant awarded to the senior author. The senior author is grateful to Fudan University officials in Shanghai. Particular thanks go to Professors Sun Shijin and Liu Hao Jing who arranged for access to most of the Chinese informants. Mr. Chaofeng Wang helped with translations and Pascal compilations of the Chinese version of ATTITUDE called TAIDU. Professors Runjahm Hoosian (Hong Kong University) and Oliver C.S. Tzeng (Indiana University-Purdue University Indianapolis) provided the Chinese semantic differential bipolar scales.
4. The typical matrix used in factor analysis orders variables down columns and cases across rows, and is called an r-matrix. As we are interested in factor analyzing cases rather than variables, we simply transpose the normal r-matrix used to factor analyze items to form a q-matrix. The communality loadings for cases give us an objective measure of how intersubjective each informant is by comparison to all other informants.
5. An anonymous reviewer raises concerns about sample selection biases created by “throwing out” data that threaten both the external and internal validity of studies using Surveyor. Later in this paper we give at least nine suggestions for minimizing the need to throw ot any such data. Our intent is to warn unwary users of Surveyor not to use it without safeguards for minimizing such data loss.
6. We use the term “data shrinkage” to distinguish implausible, outlier data such as ratings of “father”, “mother”, “God”, “lover”, “friend”, and “ grandfather” as “neutral” or “infinitely bad”. The statistical methods we use allow us to separate out cultural informants who appear to be producing responses carelessly, or haphazardly.. This is equivalent to retail stores who know they are losing merchandise but can’t pin down whether it is due to theft, damage, poor accounting procedures, or whatever, so we follow non-pejorative commercial terminology of calling this loss “shrinkage” rather than something like “cheating”.
7. A communality is simply the proportion of the variance that can be explained by the common factor(s). Thus, it is the multiple correlation of the variable with the factor in Figure 1.
8. David Heise in an email has confirmed the same pattern for his present Surveyor-based American study.
9. Miller McPherson (in a personal communication) has suggested that getting rid of variance should not be the solution. This is decidedly not the intent of our using q-factor analysis. Rather, the objective is to weed out respondents who clearly are not taking the task seriously. For example, low communalities are a sign that a rater is not being conscientious. Typically, such raters always move the cursor to either the extreme left (or right) in every case, disregarding the pole of each scale.
10. The various evaluation equations produce high r-squares close to the Japanese, Canadian and American norms of about .88-.90, so apparently these poor informants are most careless in their judgments of the potency and activity dimensions, The component loadings are somewhat better than commonalities because commonalities would change for a subgroup of raters from a subculture whereas the loadings would not. I have used communalities simply to illustrate the value of q-factoring to overcome part of the problem created by unreliable informants.
© Electronic Journal of Sociology